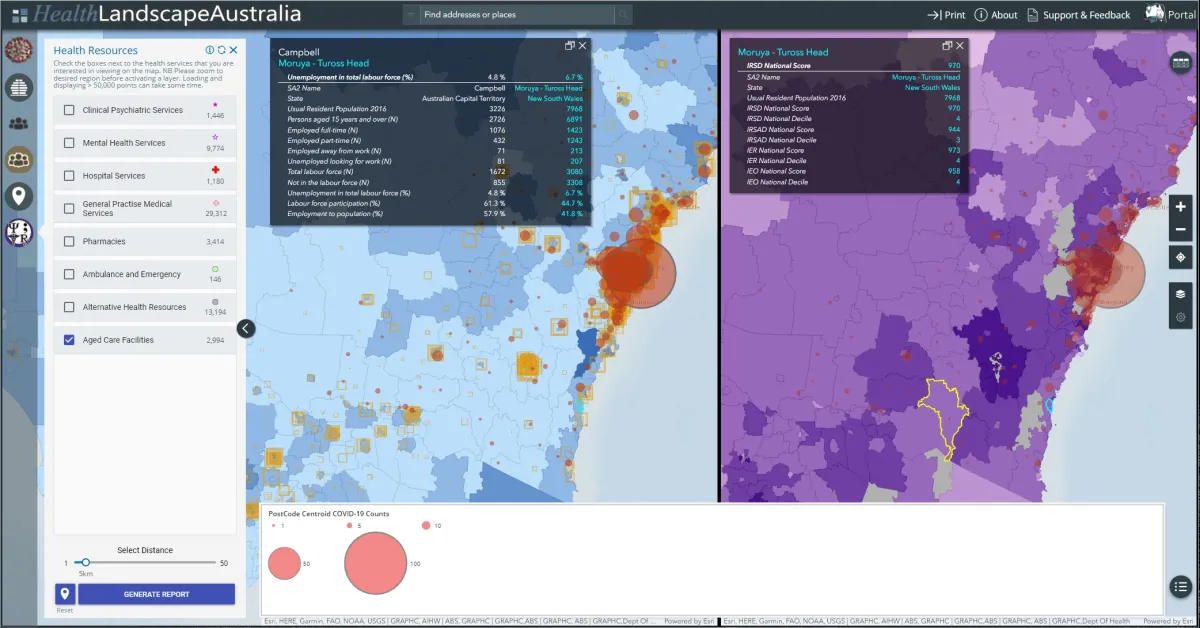
Maps key to solving health pattern puzzles

The value of maps in health research, and collaborating with Black Dog Institute to inform suicide prevention strategies
The utility of maps doesn’t end when your phone chirps ‘you have arrived at your destination’. Maps can paint a picture beyond simple navigation. They visually translate complicated information, find hidden patterns, and even identify trends in health.
Before fancy mapping tools or GPS were invented, a paper map used by Dr John Snow in 1854 was key to solving a cholera outbreak in Soho, London. Snow mapped the houses where cholera deaths occurred, and it became clear that cases were clustered around the Broad Street water pump. It turned out the drinking water was polluted by a baby’s nappy contaminated with cholera. The mapping and statistical methods used by Snow helped bolster his germ theory that the disease was water borne, and led him to be considered the father of field epidemiology.
Fast forward to the modern day where epidemiologists and health professionals still use maps to identify trends in disease outbreaks just like Snow did, however computer driven geographic information systems, or GIS for short, can do much, much more.
“GIS allows us to organise, understand and communicate a multitude of spatially connected data and in some cases, location is the key that lets us link otherwise unrelated pieces of information,” says Paul Konings, Senior Research Spatial Scientist at the National Centre for Geographic and Analysis in Primary Health Care (GRAPHC).
“We combine information from many different sources such as where illnesses occur, health service provision, socioeconomic status, population age, or education and environmental factors to help untangle the relationships between them.”
But what kind of health problems can GIS help unlock?
Over the last 9 years the GRAPHC team has engaged in many collaborations including: analysing children’s BMI across the ACT, identify participation in bowel cancer screening, identify the relationship between drought and cryptosporidiosis, describe spatial inequities of mental health nurses in rural and remote Australia, and recently joined forces with the RSPH Global Health team to tackle COVID-19 with real time mapping.
The GRAPHC team are now predominantly focused on suicide prevention strategies. They are an instrumental collaborator in the development of a number of leading edge suicide prevention initiatives that resulted in the 2019 Research Australia - Highly Commended Award for Data Innovation. The team recently received funding from the BlackDog Institute to further their work on the LifeSpan Integrated Suicide Prevention project, an online interactive mapping tool that identifies suicide hotspots and mental health resources which helps inform local and national suicide prevention strategies.
“Their expertise is a crucial component of our suicide ‘hotspot’ mapping system, which helps us inform the development of both local and national suicide prevention strategies. And their incredible work on our online interactive resource ‘Atlas’ has helped us deliver an invaluable tool that enables researchers and policy makers to produce maps, build analysis and answer key questions around the co-ordination of suicide prevention,” says Director and Chief Scientist of the Black Dog Institute, Scientia Professor Helen Christensen, AO.
This approach of using maps and spatial-temporal analyses to assist in suicide research, provides new insights, and practical implications for suicide prevention applied research, and directly influences policy, and health service provision in community settings.
“Our vision is to improve equity and access to health care services through better resource allocation. To make population health visible by incorporating a broad spectrum of interconnected health metrics and making data and analyses meaningful and accessible for public policy, social initiatives and social transformation and by facilitating collaboration between community, health care service providers, academia, and policy makers,” says Konings.
So keep an eye out for informative maps. It’s unlikely they will lead you to buried treasure, but they can simplify, clarify and help find solutions to different research problems.
Learn more about the GRAPHC team and their projects on their website.
* The LifeSpan Atlas is a collaborative project with the Black Dog Institute Centre of Research Excellence in Suicide Prevention (CRESP) which aims to reduce the suicide rate in Australia.
